MECHANICAL SYSTEM
In order to make the tree move up and down, we vertically attached a threaded rod to a motor. We mounted this in a laser-cut hardboard box with a middle support with a bearing to keep the rod upright. We added a threaded insert into the base of the tree, which moves up and down based on which direction the motor spins. So that the tree does not free- spin and fall down the rod, we added laser-cut “roots” to the tree, which run up and down slots in the box, where there are 3d printed bearings to allow the roots to move smoothly. The trunk of the tree was created using recycled cardboard tubing. Here are the mechanical renderings of the branch and base from SolidWorks which were laser-cut using hardboard. There are also renderings of the 3d printed bearing and motor mount.
ELECTRICAL SYSTEM
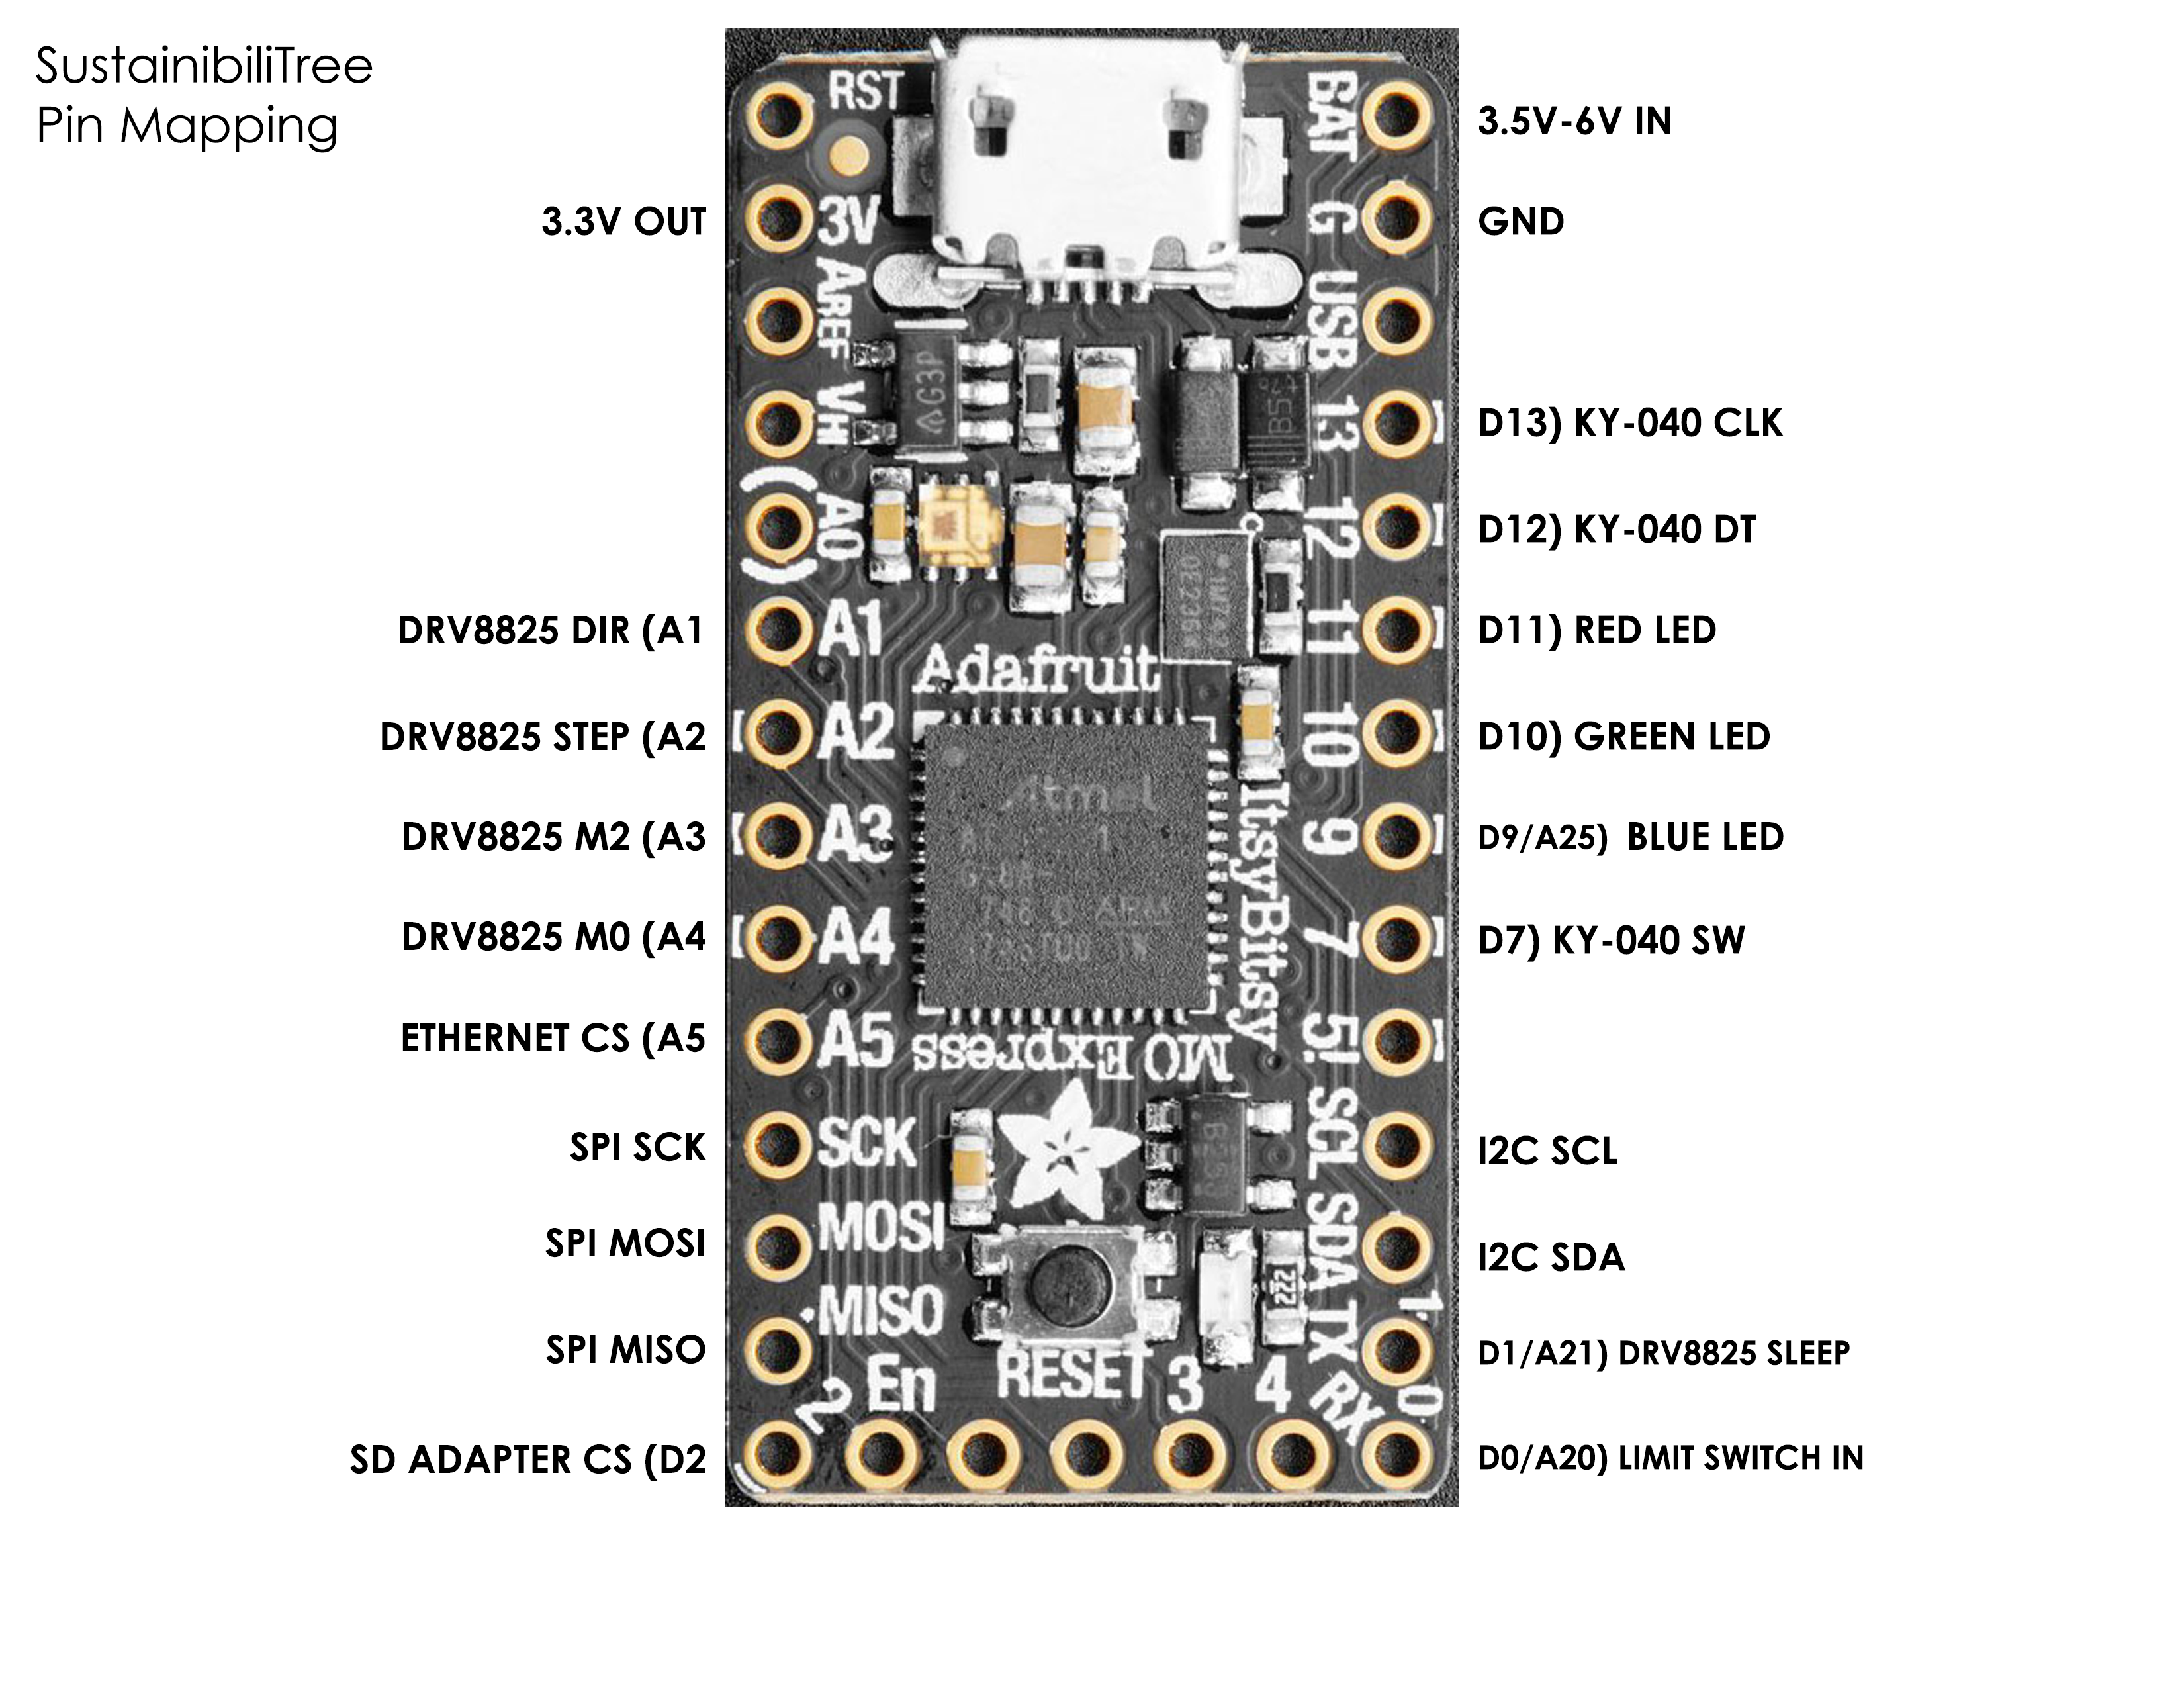
Our electrical system integrated the following components:
Power supply (24VDC 3A)
Step down converter and voltage regulator (LM2596 DC-DC in 24V-5V config.)
Development board (ItsyBitsy M0 Cortex)
Stepper motor (NEMA 17)
Stepper motor driver (DRV8825)
Custom high current RGB LED driver (Piranha/Superflux LEDs w/ IRFZ44N N-FETs)
MicroSD Card Adapter
Real-time clock (RTC) module (DS3231)
Ethernet module (W5500 w/ hardware TCP/IP stack)
8-digit 7-segment display (2x 0.56” 4-digit 7-segment LED display w/ I2C backpack)
Rotary encoder w/ pushbutton (KY-040)
Limit switch (SPDT momentary micro switch)
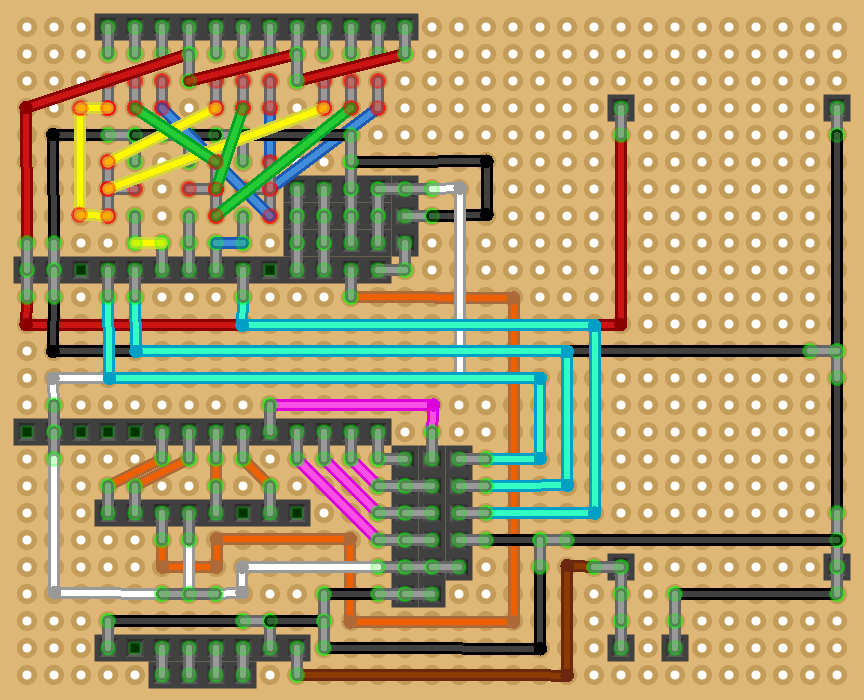
After performing benchtop tests of the full assembly, we designed and fabricated a final circuit on protoboard (pictured left).
SOFTWARE SYSTEM
Our software system’s main role is to accept, store, and visualize energy usage data by actuating our stepper motor, LEDs, and 7-segment display. We are still in contact with campus IT (as of 12/13/2019) about setting up a dedicated network port for our sculpture to use at our final installation location, but our goal is to be able to receive campus-wide energy usage data in near real-time via ethernet and store that data on a built-in MicroSD card. Our system will read the most recent data from the SD card by default, though we included a display and rotary knob on our sculpture’s front panel so that people can choose to go back and select any date for which we have data. Our program will read the data for whatever date should be displayed and then visualize that data on our sculpture. It spins the stepper motor until the tree is at the height corresponding to the raw energy usage for the day, it changes the color and brightness of the LEDs to show how our energy usage for that day compares to our running average, and it shows the date being visualized on the front-panel display.

