Sprint 1
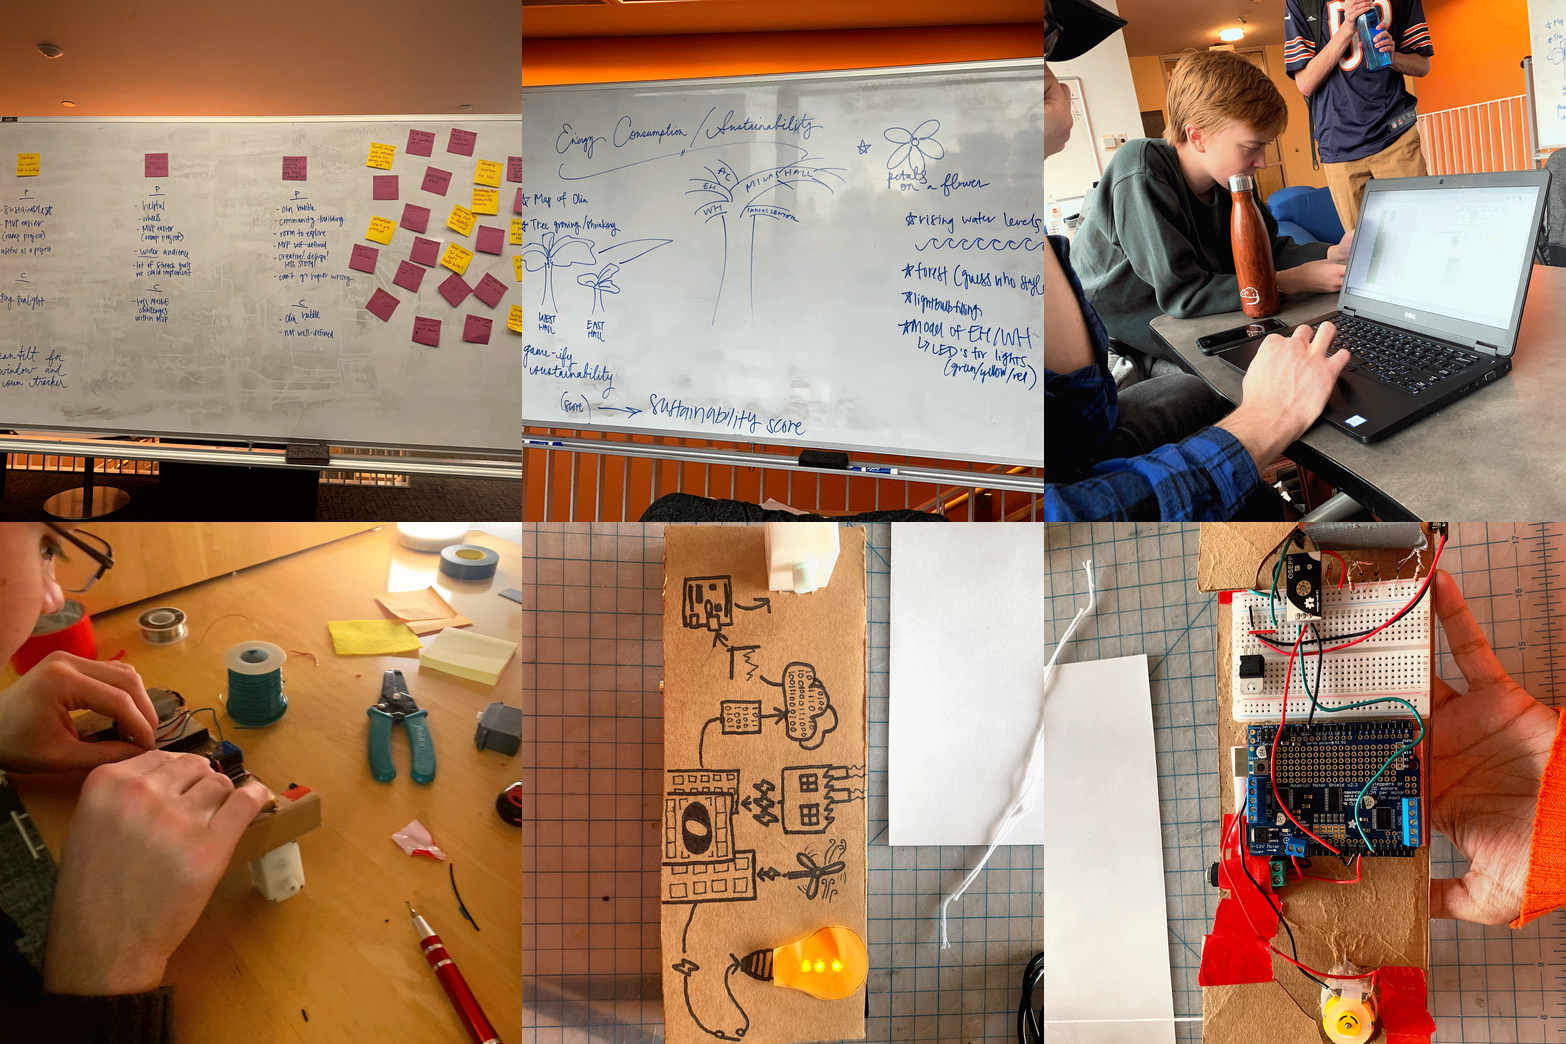
Understanding what all the members of our team were passionate about
Determining the best method to display energy consumption data
Building a circuit to light up an LED
Creating a rough prototype of a tree
Sprint 2
Met with Olin College’s Associate Energy Engineer to understand what data we were able to receive and how often we were able to receive it
Met with IT about setting up this sculpture long-term
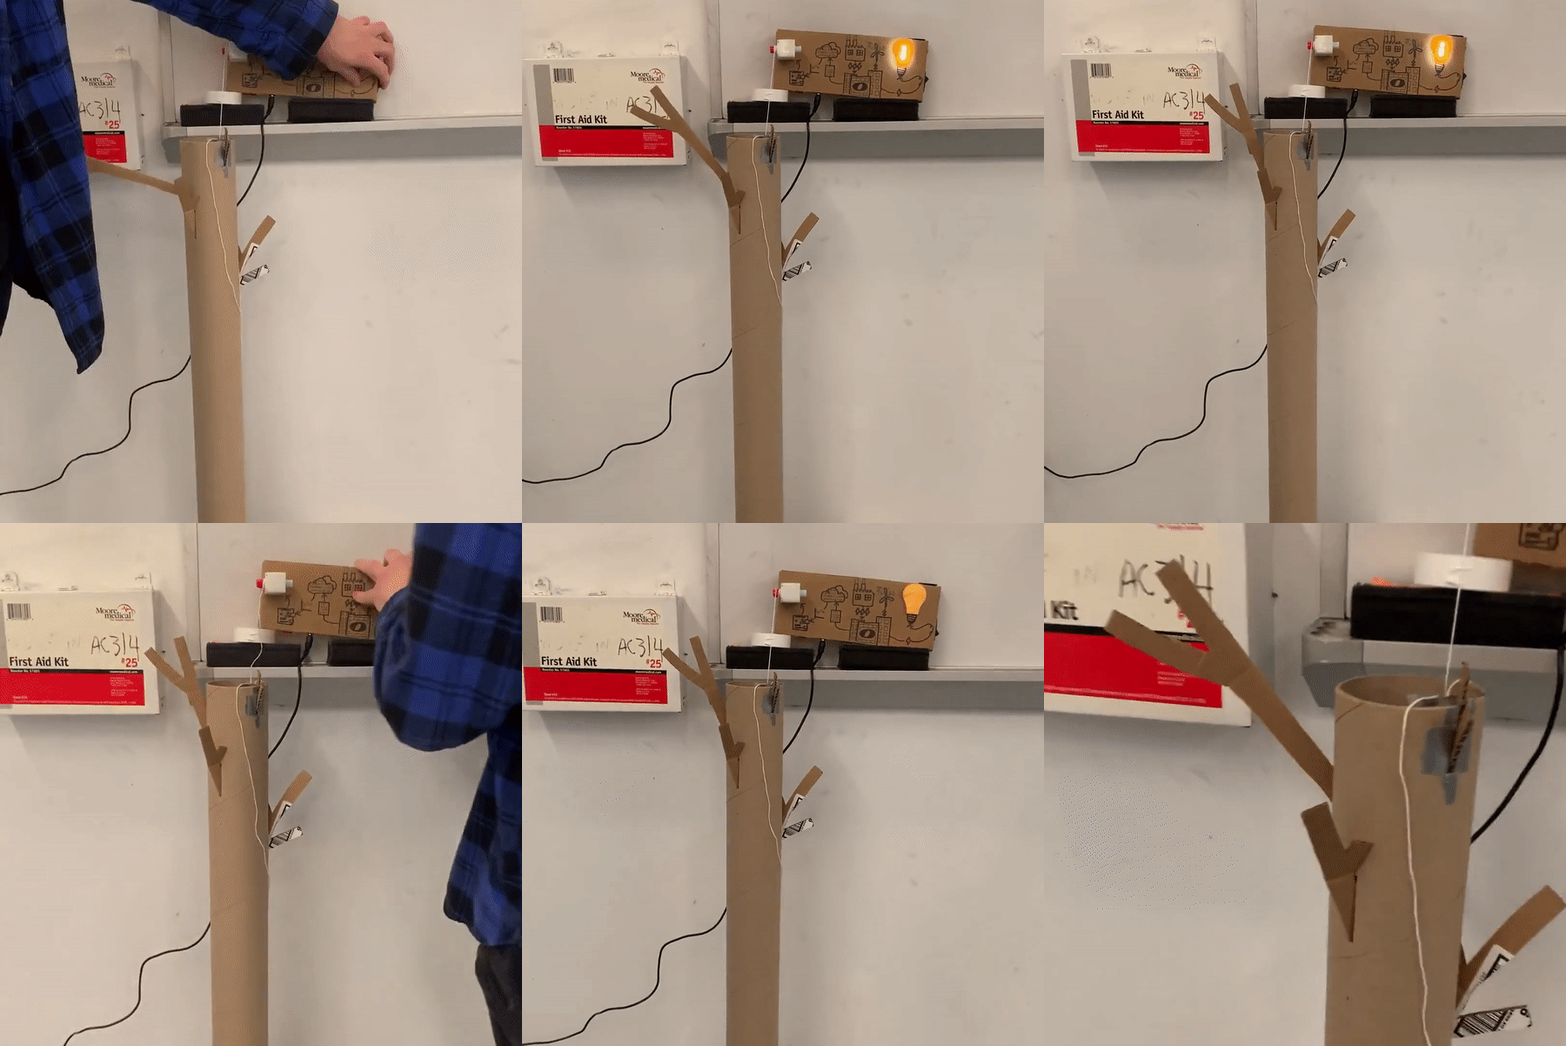
Built a couple of iterations of a scissor lift for the tree to move up and down
Decided on using a threaded rod system for the tree to move up and down
Attached branches to the tree sculpture
Built a base for the sculpture
Created a working prototype of a tree moving up and down
Created our first iteration of LED flowers
Sprint 3
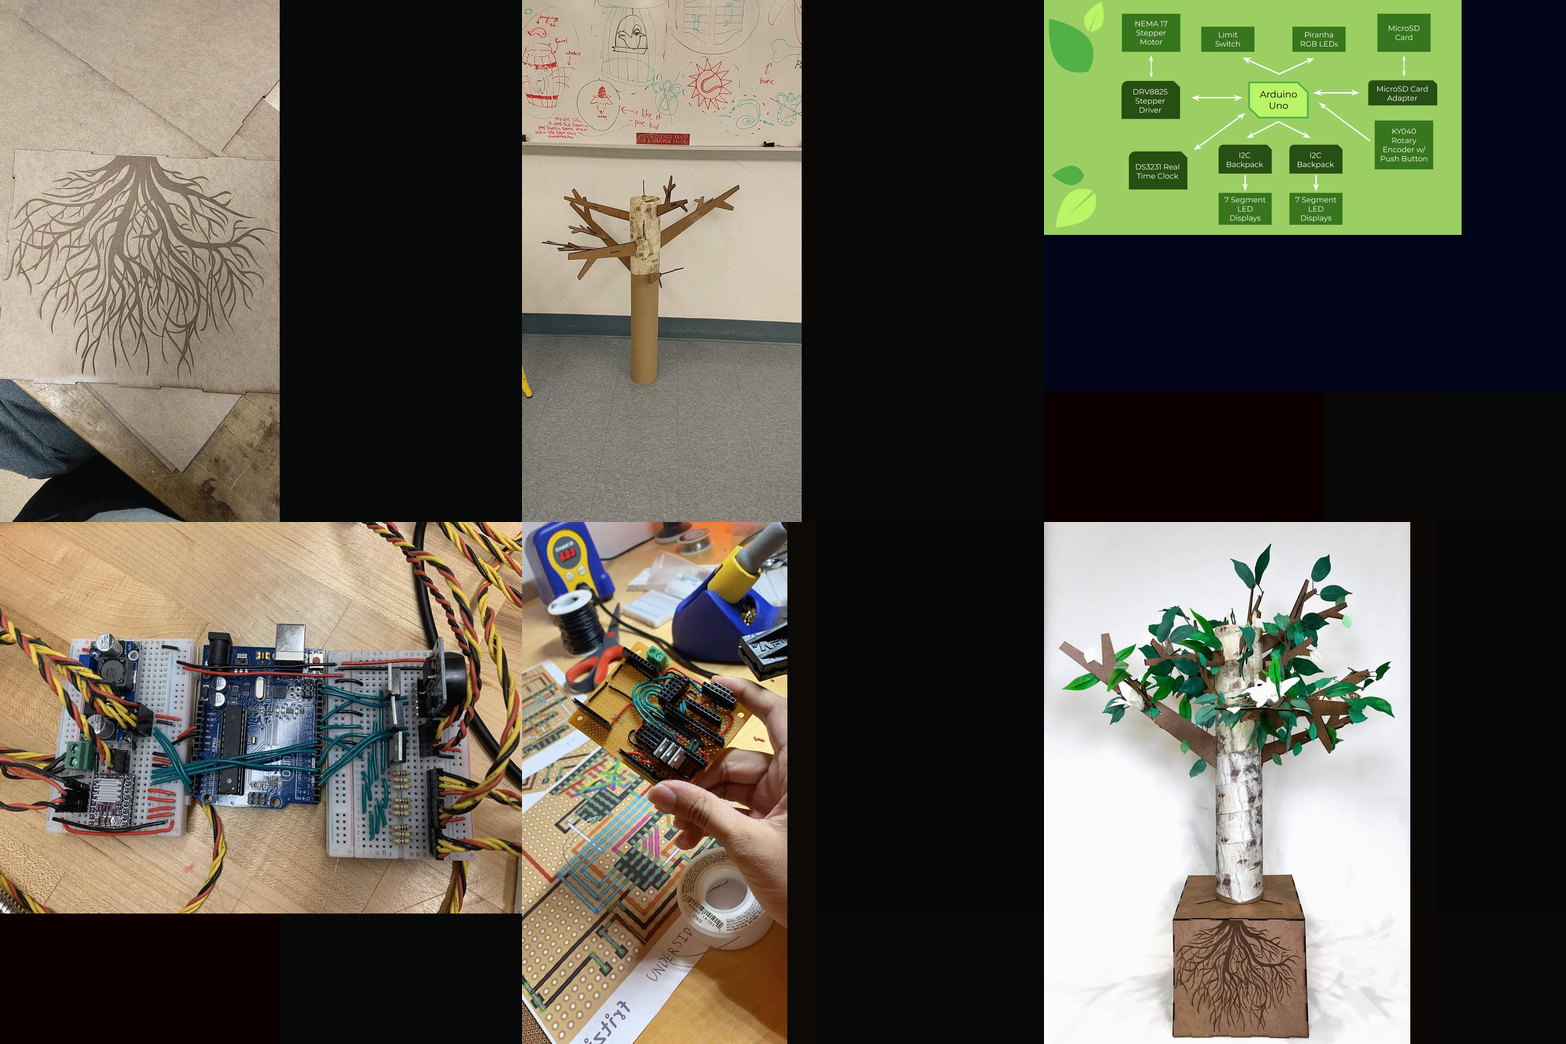
Used final material to create the sculpture
Finalized circuitry and attached it to the base of the trunk
Integrated the mechanical, electrical, and software subteams’ work
Used an LCD Screen to display the date of the energy pulled
Setup Rotary Encoder to calibrate the stepper motor during testing
Attached LED’s to flowers and programmed them to change colors to represent the percent improvement each day according to the data
Made the tree move up and down according to data pulled
Finalized integration of all subsystems
Decorated the tree in order to create an aesthetically pleasing look
Final
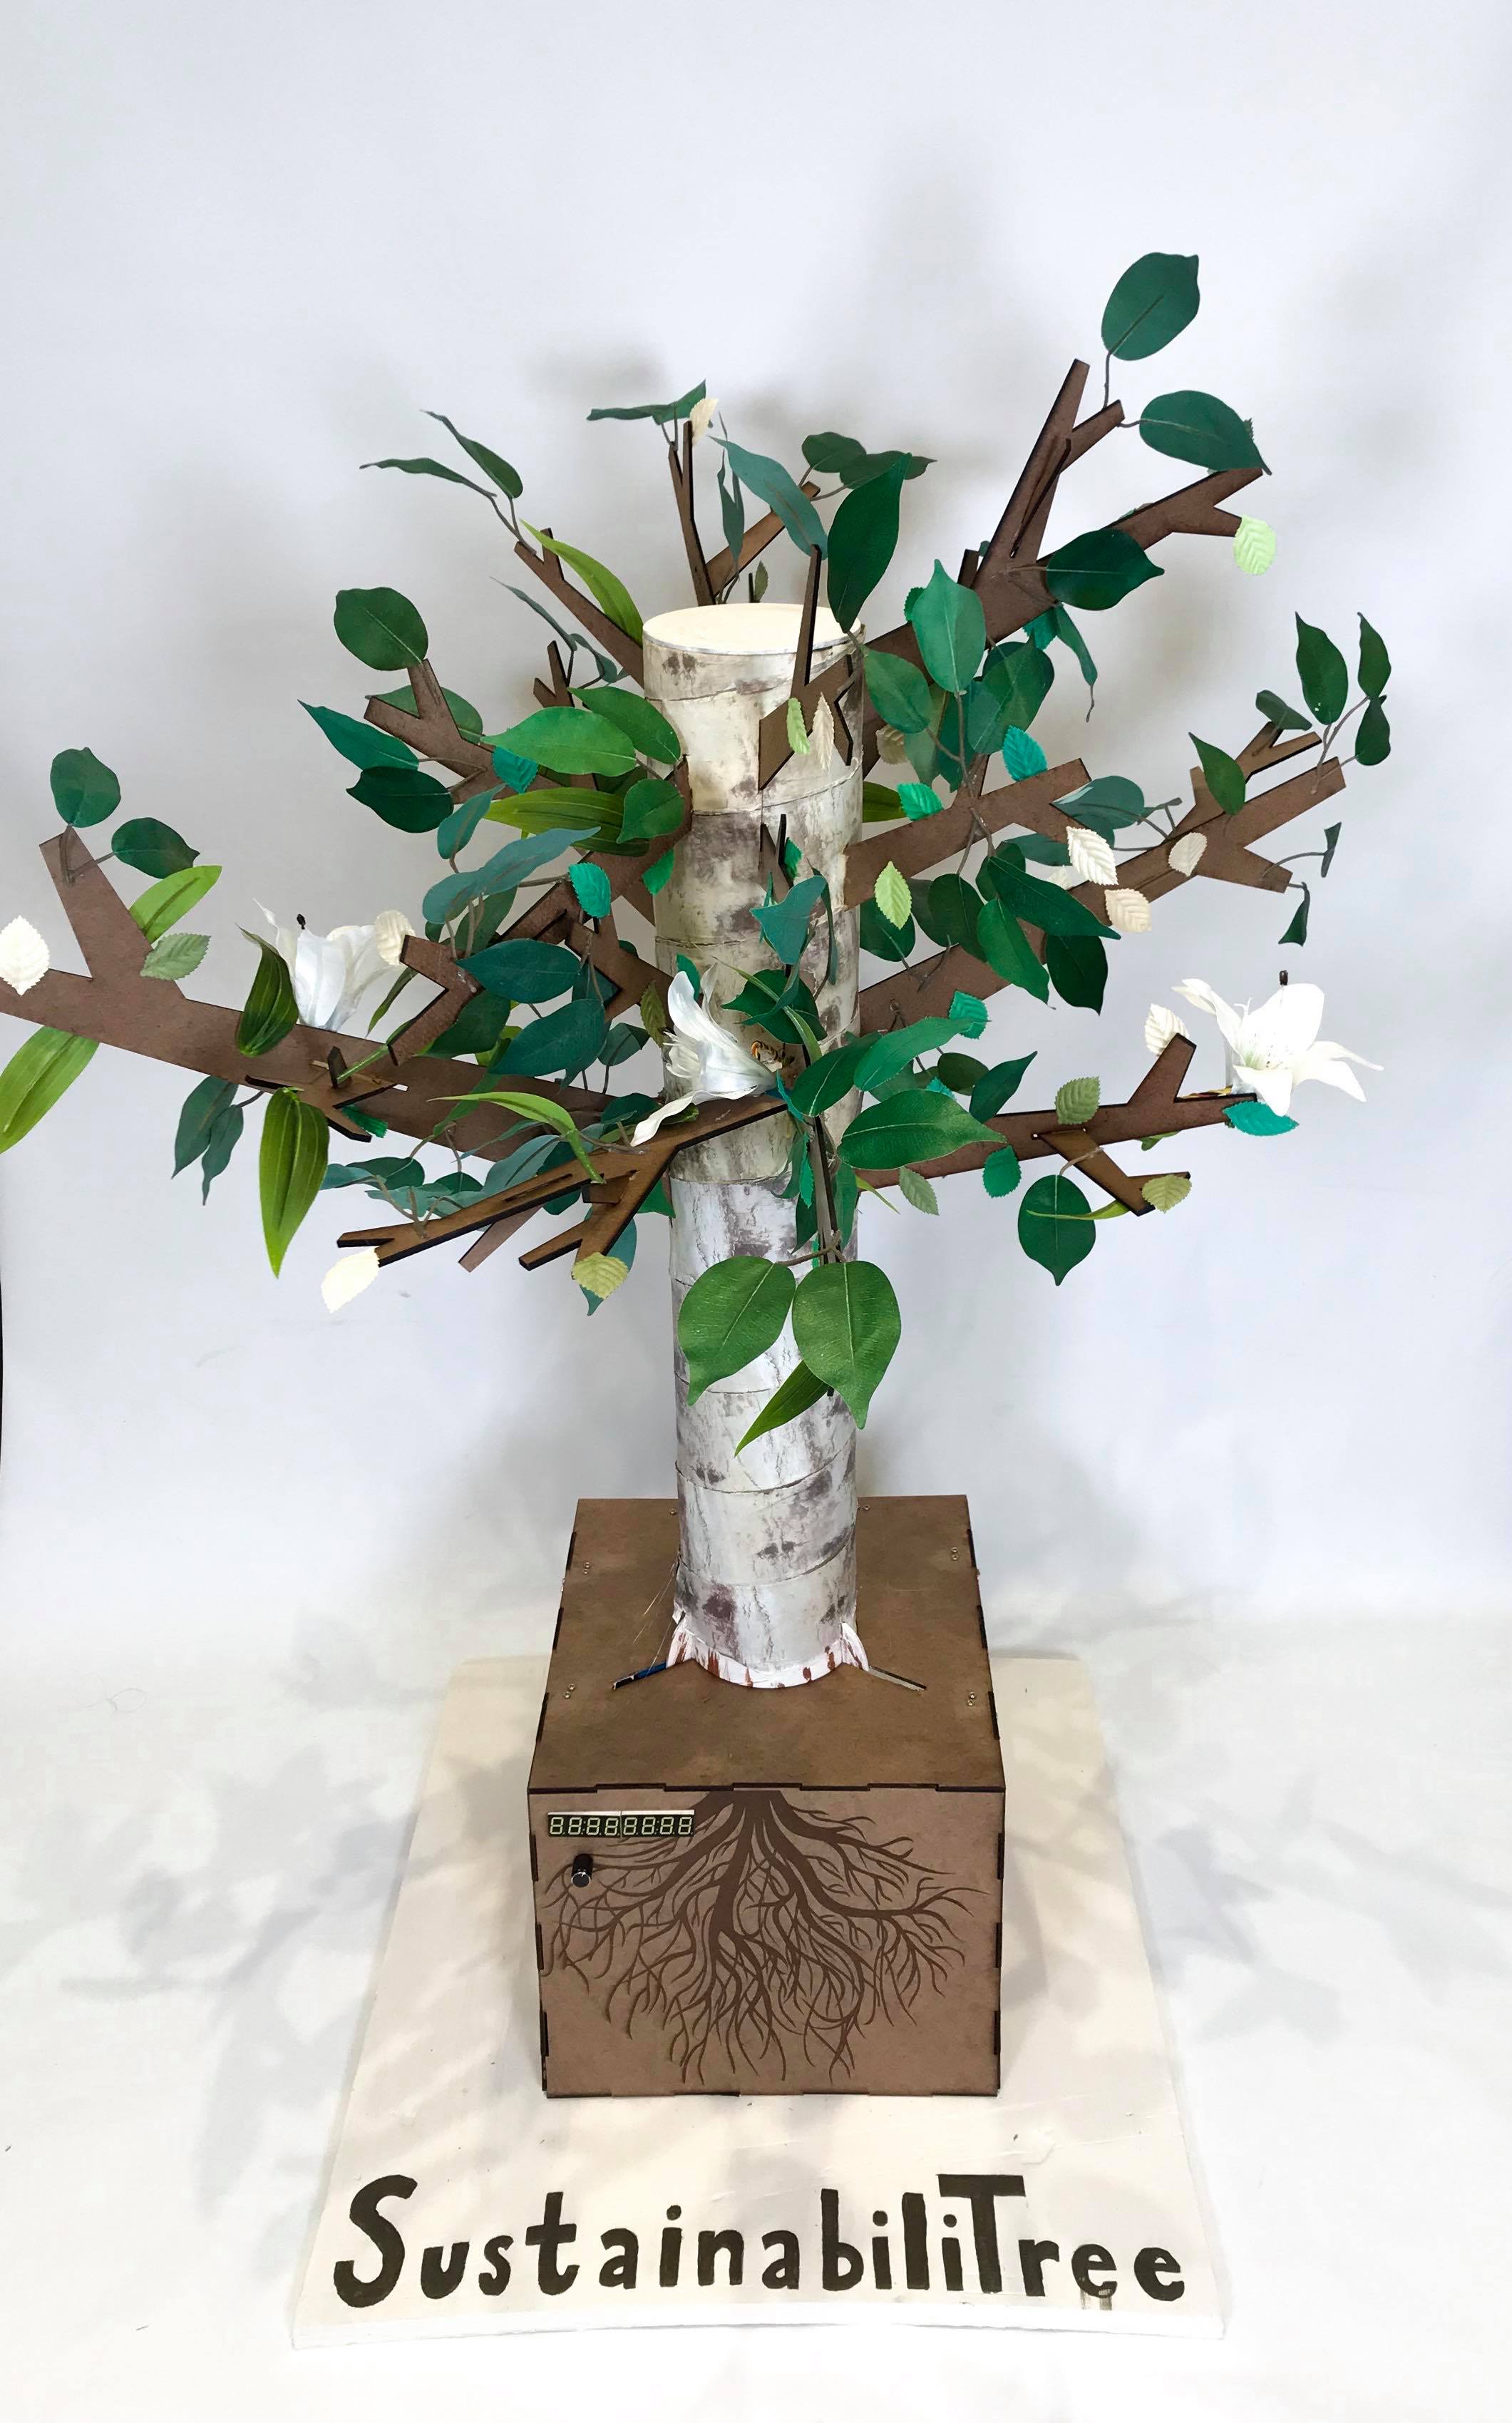
The day before the final demo, our microcontroller (Adafruit ItsyBitsy M0 Express) blew out and rendered us unable to have a kinetic sculpture on Demo Day. Before it blew out though, we reached our MVP and one stretch goal. Here is everything our tree was able to do until right before Demo Day:
The tree was the height that corresponded with an energy usage value, with a taller tree meaning less energy being used
The lights turned green if the energy used was less than the day before, and turned purple if it was more
The LCD screen displayed the date of the data being shown by the tree


