Project Summary
We iterated upon a bicycle rack that attached to the rear wheel of a bike, using a magnetic sensor to count the number of times a smaller wheel spun relative to the large bike wheel. This information was collected using a Photon microcontroller which sent the information to a web app the user could interact with to set their own distance goals and control what websites would be blocked until they reached their goals. Lastly, we created a Chrome extension which blocks the user's inputted sites until they have biked their set distance. Keep reading to learn more about the final design!
Before you get started, here is a diagram showing how our whole system connects (red blocks are mechanical, purple are electrical, blue are software, and orange represents the user) and a video of it in action:
Before you get started, here is a diagram showing how our whole system connects (red blocks are mechanical, purple are electrical, blue are software, and orange represents the user) and a video of it in action:

Goals
One of our team's main goals was to make a polished final product. We defined this as a product which:
Each individual members' learning goals are included in the About section.
- Comes in one piece
- Easily attaches to the bike
- Fits most standard-sized bikes
- Doesn't interfere with other rack attachments
- Is weather resistant
- Is easy to charge and turn on/off
- Has a battery life of over 5 hours
- Is stable (meaning components are secure) and does not break easily
- Has an intuitive UI for software
- Has aesthetically pleasing mechanical and software design
Each individual members' learning goals are included in the About section.
Electrical
Overview:
Our electrical subsystem is a small circuit built to measure the rotations of the bike wheel. A Photon microcontroller reads measurements from our sensors and posts that information to the internet. We will discuss how we settled on the components used for our wheel encoder circuit and how we chose the Photon microcontroller. We will also talk about how the firmware code for the Photon works and what we used to power our system.
Wheel Encoder Circuit:
Our method of recording how far the user has biked has gone through many iterations. In the first iteration, we used a shaft encoder, a device that measures how many rotations a wheel has completed. We quickly realized that store-bought shaft encoders would not work because they have short rotation lifespans compared to what our wheel would undergo during use. Next, we tried building our own optical shaft encoder. This worked, but only under certain lighting conditions, which we could not ensure when the user is biking. Our team did consider attaching an LED near the encoder to guarantee stable light conditions, but this would use more power and add complexity which would make our system less reliable.
Instead, we decided to switch to using a magnetic sensing system since we read that other people had used this method in very similar situations with success. When making this switch, we had to decide between using a reed switch or hall effect sensor to sense each time the magnet on the small wheel completed a rotation. We decided on using a reed switch because it does not need to have power run through it to work (it actually mechanically responds to magnetic fields). Hall effect sensors are also harder to integrate into an existing circuit. To make this decision, we also consulted an employee from DigiKey who had completed a similar project.
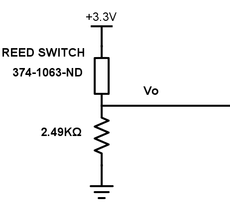
The circuit diagram above shows the simple encoder circuit used. The circuit is powered by the 3.3V Photon power supply. When a magnet comes close to the reed switch, a physical connection is closed, and the voltage across the resistor (Vo) goes to about 3.3V, since the majority of the voltage drop is across the 2.49K resistor. We measure Vo using a microcontroller to figure out when a magnet has passed by our reed switch.
The reed switch used in our project can be purchased at the link below:
http://www.digikey.com/product-detail/en/MK06-4-B/374-1063-ND/2171040
Microcontroller:
During early iterations of our project, we used an Arduino connected to a Raspberry Pi in order to read measurements from the encoder wheel and to upload that information to the internet. We had the Arduino take measurements, send that information to the Pi over serial, and then had a Python script on the Pi that would take information and use the Python Requests library to post it to the internet. Several downsides to the initial approach included a long boot-up time, relatively high power consumption, and a physically large and bulky system.
We decided we needed something similar and that it didn't make sense to use the Pi exclusively for its Wi-Fi capabilities. An Arduino Wi-Fi shield would cost $80 and cheaper, unofficial ones severely lacked documentation and didn't seem worth the gamble. For this reason, we settled on the Photon microcontroller, which costs $19. The Photon is smaller than the Arduino, has cloud and Wi-Fi capabilities built in, and has easy to use power management firmware libraries. This worked out well, and the Photon ended up being much better suited for our project than the Arduino and Pi.
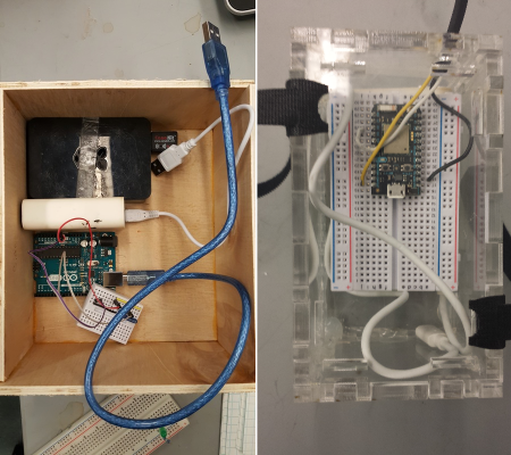
A visual comparison of the old Arduino + Pi system on the left and the Photon on the right.
Firmware:
GitHub Link: https://github.com/POE-Fall-2015/BikeBit-Encoder/blob/master/photonCode/photonCode.c
The Photon development process is not typical because code is pushed to the Photon through the internet. We used the Photon developer IDE located at https://build.particle.io/build for development. We also used the online Photon console to log things, taking the place of the more traditional Serial out which is used for Arduino projects. The online console can be found here: https://dashboard.particle.io/user/logs.
The firmware code has an interrupt handler attached to the pin that measures the voltage across the resistor in the reed switch circuit. This interrupt handler, called onReedSwitchHigh, is triggered by rising voltages. It increases a variable that keeps track of the number of rotations, debouncing the input in order to avoid increasing the number of rotations multiple times when only one rotation is made. It's necessary for the code that keeps track of the number of rotations to be called by an interrupt handler. We found that normal user code stops running when the Photon loses its Wi-Fi connection and only interrupt handler code can still run.
Several conditions must be true in order for the Photon to decide to upload the information it has to the internet. First, the Photon checks that it has a stable cloud connection before attempting to upload anything. Then it checks to see if a session has ended, which means that the interruptHandler has not been triggered by a wheel rotation for over ten seconds. Finally, it checks that it has not already uploaded the same information in a previous loop iteration. If all these conditions are true, the Photon calls a function to post the number of rotations counted to the Particle cloud.
We chose to post to the Particle cloud instead of our own webserver because the Photon HTTP Requests library is still lacking functionality and breaks under certain conditions the user will encounter, like the Photon going in and out of Wi-Fi. The Photon has an easy to use Particle.publish() function that posts information to the Particle cloud, and we found that this function consistently worked. To get information from the Particle cloud to our own webserver, we then used a Particle service called webhooks that has the Particle servers automatically send a POST request to our servers when it gets a POST request from our Photon device.
Powering our project:
It was important to us that we built something that would be portable and not require constant recharging. To power our microcontroller, we chose to use a small battery pack that holds a total charge of 6000maH. During initial tests with our Arduino/Raspi setup, we found that the Arduino and Raspi stayed on for over eight hours while maintaining a wifi connection, which was already impressive. After switching to the Photon microcontroller alone, we found that battery life improved to last more than twenty hours.
Software
Overview:
The software portion of our project consisted of three major components: microcontroller code for measuring the number of rotations made by the wheel and uploading that to the internet, a web application for saving data and presenting an interface for users to use and edit options, and a Chrome extension that redirects users away from blocked sites. We will discuss the web app and Chrome extension below.
Web App:
Github link: https://github.com/POE-Fall-2015/Bikebit-Webapp
View our live webapp: http://bikechill.herokuapp.com/dashboard
We built a web application using MongoDB, Express, and Node.js on the back end. We used Bootstrap templates to build web pages that the user uses to interact with our application. We decided to separate our web application into web API routes that return JSONs for the Chrome extension and the user-visible portion of our web app to use. The portion of our web app that is visible to users does client-side rendering, sending API requests to our server for information and then populating the web page.
API Routes
GET/POST bikeSession(s) => Upload and save a bikeSession object or fetch all bikeSession objects. A 'bike session' is considered to be a number of wheel rotations that occurs followed by a period of inactivity for five minutes. For instance, if a user bikes in the morning and again a few hours later, there will be two bikeSession objects posted to the server since the bike was stationary for longer than five minutes at the end of both bike sessions.
The bike session model:
{
createdAt: Date,
rotations: Number
}
GET/POST/PUT/PATCH/DELETE user=> Standard HTTP routes for interacting with the user object in our database. The user contains information about a user's goal distance, goal rate, blocked sites, and several other settings.
The user model:
{
username: String,
blockedDomains: [String], //Array of domains the user will not be allowed to visit until they reach their goal distance
goalDistance: Number, //The distance that the user needs to bike before they can access blocked sites
goalRate: String, //Either "week" or "day". When set to "week", the user must achieve their goal distance for the week
before they may access blocked websites. Wehn set to "day", the user must bike their goal distance
daily.
wheelSize: Number, //The diameter of the measuring wheel in inches.
goalUnits: String, //Units for the goal distance specified by the user. Either "miles" or "kilometers"
createdAt: Date,
updatedAt: Date
}
For the purpose of keeping things simple with our web app, we decided that it would only work for one user as building a sign up and login page for our POE project seemed like overkill. Still, we left in the ability to create multiple users and to get a specific user in case we want to extend our application in the future.
GET userStats =>
{
canAccess: //boolean value determining whether the user may access blocked websites
distToGo: //distance user must bike until they reach their goal. This is negative if the user has already reached their goal
progress: //distance user has biked during this "week" or "day" towards reaching their goal
lifetimeTotal: //total distance user has ever biked
user: //user these stats are associated with (A user object, which is described above).
}
GET graphData/:time => Returns the data necessary to display a bar graph for the distances biked during a specific week. The 'time' query parameter is used to determine which week's data to return. Time is specified as a UTC timestamp in milliseconds.
{
xlabels: //array of strings of length 7, date labels for each bar in the bar graph
ys: //y values (distance biked on or cumulative distance biked by that day)
goal: //goal distance
goalLabel: //string describing the goal, ex: "5 miles" or "4.8 kilometers"
graphTitle: //string including the date range that data is from, ex: "cumulative miles biked the week of 12/7"
}
User Facing web pages
We used the "Creative" Bootstrap template, available from http://startbootstrap.com/template-overviews/creative/.
Options Page:
The options page is where the user can set their goal distance and goal rate (but only when they have already achieved their goal). They can also add blocked sites. When the user has biked their goal distance they are able to remove blocked sites. Because the goal distance cannot be changed unless the goal for the time period has been reach, a modal pops up to confirm that the user wants to set their goal at the particular value.
Dashboard Page:
The user is redirected to the dashboard page when they attempt to access a blocked site where a message is displayed telling them how much further they need to bike. Lower down on the page, a bar graph displaying how far the user has biked is displayed using the Chart.js library. Since the majority of the logic for getting or parsing this information is on the server side, the client code is relatively straightforward and basically consists of getting data and then drawing or inserting it into the web page.
Chrome Extension:
GitHub Link: https://github.com/POE-Fall-2015/BikeOrLock
In the final iteration of our app, the user never interacts with the Chrome extension itself. The sole purpose of the extension is to redirect the user to their dashboard on the web app (which we'll talk more about next). To do this, the Chrome extension makes a GET request to the web app each time the user visits a web page. This gets the most updated list of the user's blocked sites and the distance they have traveled in the form of a JSON object, which it then parses. This all occurs in the main content script (block.js). Our Chrome extension also has two background scripts. Chrome allows background scripts to use certain Chrome APIs that cannot be accessed in content scripts. In our case, we used the chrome.tabs API which allows the extension to interact with the browser's tabs. Background scripts run on every page.
One of our two background scripts, urlListener.js, uses the chrome.tabs.onUpdated API and chrome.tabs.query API to sense when the url is updated and sends the url of the active (open) tab to block.js, the content script. Figuring out how to send this information from the urlListener.js to block.js proved to be difficult. At first we were using ports, which create long-lasting connections between scripts. However, this was not the right solution because the port does not empty itself of previously sent messages and would thus send all the urls that had been visited to block.js. For a long time, we tried to work with the port system and find some work-around that would let us use it because we could not get Chrome's sendMessage feature to work. SendMessage actually uses ports under the hood by creating, using, and destroying the port each time it is used. Eventually we got sendMessage working. In retrospect, upon realizing that this was the method we were looking for, we should have invested more time into getting it to work instead of attempting to use ports.
Our second background script, redirect.js, is called on request by block.js. and uses chrome.tabs.update to redirect the user to their dashboard.
Block.js runs when it receives a message from urlListener.js. It then parses the url for the domain and matches it against the list of blocked sites it gets from the web app and checks the distance traveled to see if the user still needs to bike further. If the site is one of the user's blocked sites and the user still has some distance left to bike, redirect.js is called and the page redirects.
To parse the url, we used https://www.npmjs.com/package/url-parse. However, because the extension uses neither node.js or browserify, this code is included in the extension as a script, urlpattern.js, which is used in block.js.
Mechanical
Overview:
The final mechanical setup of our project was a bike rack with a spring-loaded measuring subsystem and a permanently fixed battery/electronic subsystem. The measuring subsystem consisted of a mini-wheel that was spring-loaded to fit flush against the bicycle’s wheel. The wheel attached to a plate (the “bottom plate”) and a spring was placed between the bottom plate and a top plate. The top plate was permanently attached to the rack with zip ties. The distance between the plates was constrained by the maximum distance we calculated we would need to accommodate wheels of standard sizes (which we chose to range from 26” to 28” diameter). We attached a mini breadboard to the bottom plate so that its position relative to the mini-wheel would remain fixed. We attached a box that contained the battery and microcontroller behind the mini breadboard on the rack itself.
How we got there:
We began this project knowing that our team did not have a lot of mechanical design knowledge. Our project was designed to be mechanically simple from the beginning. We first had to decide where we would mount our system. We considered the front wheel, but the front wheel rotates relative to the frame, so we decided to mount our system to the fixed rear wheel instead. We initially considered building our own attachment system, but given our team’s lack of skill and interest in learning to design bike racks, we purchased one off of Amazon. This ended up being a very good decision -- we didn’t have to worry about the general attachment system, since the rack was (semi) reliably built. We later realized that the rack does not stay completely centered above the wheel. Were we to further iterate on this project, we would be more intentional in selecting a rack and figuring out how to fix it to the frame.
Once we decided to use a rack and solidified our subsystems (deciding to use a reed switch rather than a Hall effect sensor or an optical sensor and putting our microcontroller and battery in a box), we began ideating on various mounting configurations for our subsystem. In the first iteration we mounted the two subsystems to a plate that was set at a fixed height below the bike rack. This allowed for the measuring wheel to ride nicely over the bike wheel.
We wanted to fit everything under the rack so that the top and sides of the rack would remain usable. However, we soon realized that there wasn’t a lot of room under the rack, so we had to modify our design to be more compact and less intrusive.
After the last sprint review, we received feedback to convert our measuring subsystem from a fixed one to a dynamic one with suggestions to use a spring tensioning system. With that, we redesigned the measuring subsystem to incorporate some extension springs we found in the mechanical stockroom. Once we designed and finished CADing the new subsystem it appeared to work in our assembly, but when we built it, we realized we set some constraints and mates in our design that didn’t actually exist, and additionally, the positioning of the spring was not pulling the measuring wheel radially with respect to the bike wheel, so it was not keeping the the two wheels pressed together.
For the final iteration, we consulted Aaron who suggested a few other alternatives, and we decided to go with one that incorporates a compression spring, where the spring is positioned over the measuring wheel to apply enough pressure to keep the measuring wheel in contact with the bike wheel. We also shrank many of the parts. This prevented the parts from being able to move as much, and reduced the risk of them breaking off. This aligned with our design goal of creating a reliable product that is not easily breakable. This setup was able to keep the mini wheel on top of the bike wheel both in SolidWorks and in our prototype. Sometimes the measuring wheel slips off. This is because the rack has some freedom to move from side to side because we did not fully attach the rack to Lucy’s bike. We chose not to do so because the geometry of Lucy’s bike and the full method of rack attachment would require a lot more effort on our part, and Lucy does not want to keep the rack as a permanent fixture on her bike (the rack would be difficult to remove as well). This bike rack does not neatly align with our goals (being easy to attach). When we attached the rack to a smaller bike, the rack was flush against the seat post. We strengthened this attachment with velcro. This additional point of contact kept the rack from moving which prevented the mini wheel from slipping off. Were we to do this project again, we would have chosen a rack that is easier to attach and that stays centered and fixed above the wheel.
Materials:
Our initial prototypes were made of any scrap material we had access to: plastic, wooden dowels, and scrap wood. As we neared our final design, we shifted to 3D printing and laser cutting most of our parts out of plastic to meet our goal of creating a weather resistant product. This aligned with our design goals in several ways. Plastic is more water-resistant than materials like wood, and would allow for our product to be used in wet conditions. Furthermore, acrylic and plastic are stronger and stiffer than wood. The box was made of acrylic because acrylic is strong. Even though acrylic is brittle, the box is permanently affixed to the rack and does not directly come into contact with any abrupt forces. The wheel subsystem was made of more ductile plastic because it needs to handle pressure from the wheel. We attached the systems with zip ties; although this is not as polished as we would have liked, it is simple, it holds the pieces on to the bike, and it allows the user to still use the top and side of the rack. Furthermore, the whole system comes as one attachment. The materials and design we chose allowed for a system that was relatively easy to construct, strong, stiff, and weather-resistant.
Issues Not Specifically Related to Design
During this project, we, as a team, learned about some of our weakness. One thing we did which continually caused us trouble was impulsively buying parts without fully thinking them through. The first was a Raspberry Pi which we bought to track the distance the bike traveled and post this data to our web app. We purchased the Pi because knew it had Wi-Fi capabilities and was one of the better known microcontroller boards; basically, we didn't do much research and just bought the thing we already knew about. Turns out, the Raspberry Pi had several problems, and we ended up switching to a Photon microcontroller, which is smaller, cheaper, and simpler.
We bumped into this issue yet again when we bought a solid metal caster wheel. It was far too heavy and wouldn't allow us to embed the magnet for the reed switch in it, which was our original plan. When buying the caster wheel, we somehow failed to note that it was all metal - even though we made the decision to purchase this with most of the team present.
We learned from this project that we need to practice asking around and looking for creative alternatives before buying things. If we had sent an email to our classmates asking about Wi-Fi enabled microcontrollers early on, we would have quickly learned that the Photon was a great microcontroller for our project and that we didn't need a Raspberry Pi. Similarly, if we had looked into 3D printing a wheel earlier, we could have avoided the bad choice of buying the caster.
Our team's main method of communication was using Facebook chat. This worked well for our team as we were able to easily and quickly update everyone else on what was going on. Communication was a strength of our team during the project and helped us to steadily make progress. Because of our strong communication skills, we were often able to work independently or in pairs on tasks, getting a large amount of our project done outside of class during these smaller meetings.
Throughout the semester, we also had a few meetings where one team member would present and teach the rest of the group about what they were working on. This was something that the team really liked because a lot of us had similar goals and wanted to learn about everything, but we could not all do everything, so hearing from others about the things they were learning and working on was appreciated.
One thing our team didn't do was use the full capabilities GitHub provides us with. Frequently, people pushed new code directly to master, and we didn't use pull requests and look over other code before merging when branches were used. However, this worked for our team as we were all working on different parts of the code and were good about updating the rest of the team on Facebook with what we were working on. When reflecting, we were generally happy with our decision to forgo extensive version control.
Our team worked well together and we are satisfied with our final product. While we weren't able to completely meet every single one of our initial goals, we produced a polished, functional project that we're proud of. Most importantly, we hit many of our individual learning goals. It was a fun nine weeks, and now we know a lot more about microcontrollers, web development, mechanical design, and Chrome extensions.
Thanks for taking an interest in our project and reading along!
-Team Bike and Chill